Monitor and Analyse Your Inspection Results with Our Dashboard
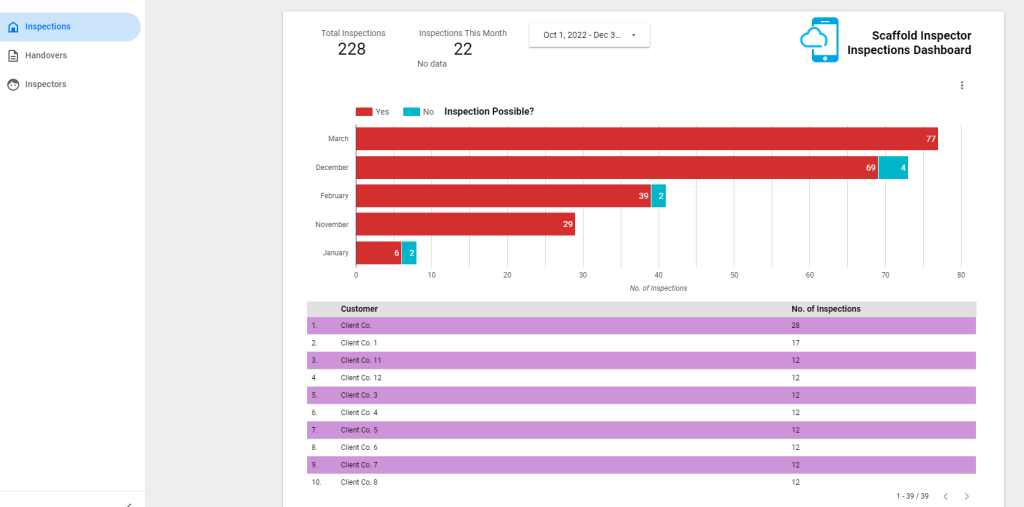
To effectively monitor and analyse your inspection results over time, we offer a user-friendly dashboard that presents your inspection and handover data in a clear and concise format.
This powerful data visualization tool enables you to identify trends in inspection and handover rates, as well as pinpoint areas of inspection failures.
The dashboard receives real-time data from the Scaff Master app and refreshes every hour, ensuring you always have the latest information at your fingertips.
You can easily filter data by dates and/or companies to gain valuable insights and display the specific information you need.
Click on the image below to explore the dashboard for yourself!

